FOTA WEB Dashboard: Difference between revisions
No edit summary |
Moved info here from "Dashboard" page, which is deleted [GTPGTM-8998]. |
||
| (9 intermediate revisions by 3 users not shown) | |||
| Line 1: | Line 1: | ||
'''Dashboard''' | ==Dashboard== | ||
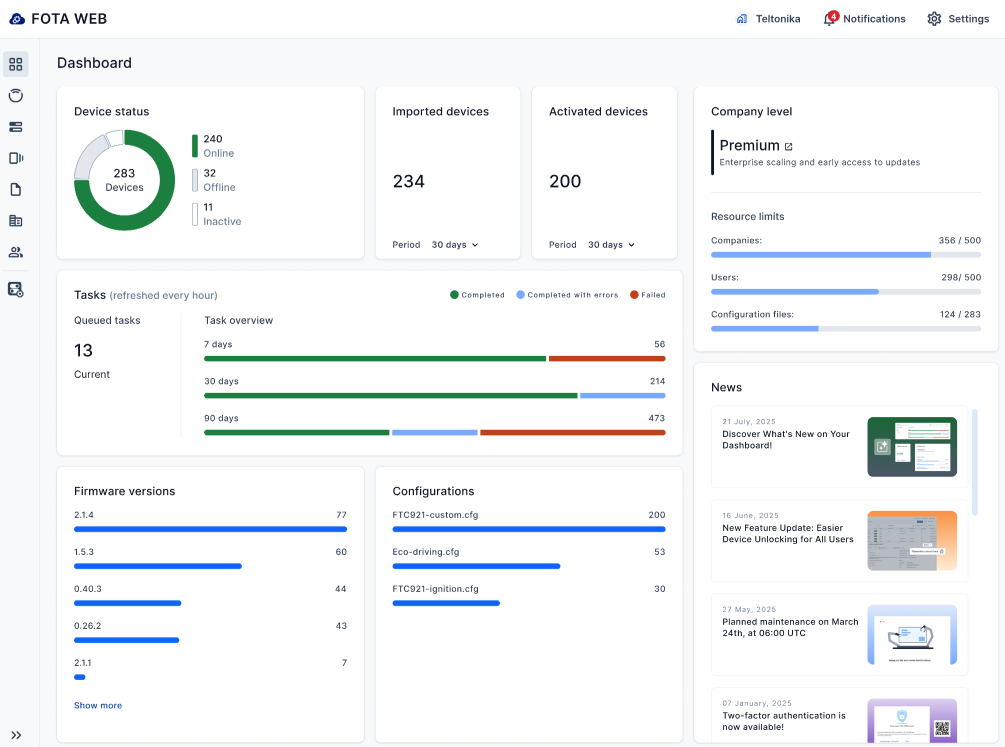
'''Dashboard''' is the initial window of the FOTA WEB page upon successful login. It includes various useful general information about the solution or your current devices' status. | |||
[[File: | [[File:FOTA WEB dashboard3.png]] | ||
==Devices status== | |||
== | '''Device Status:''' This statistic shows information to the user on how many devices are <span style="color:#20A34D">'''Online'''</span> , <span style="color:#DA232C">'''Offline'''</span> or <span style="color:#CBD5E1">'''Inactive'''</span>:<br> | ||
*<span style="color:#20A34D">'''Online'''</span> - Device successfully connected at least once in the past 24 hours. | |||
*<span style="color:#DA232C">'''Offline'''</span> - Devices didn't connect to FOTA Web in the past 24 hours. | |||
*<span style="color:#CBD5E1">'''Inactive'''</span> - Device never connected to the FOTA Web. | |||
By clicking on one of the device statuses, you will be directed to a list of devices with the corresponding status. | |||
[[File: | [[File:Device status3.png|405x405px]] | ||
== | == Imported devices == | ||
This | '''Imported devices:''' This statistic tracks how many devices have been imported over Today, 7 days, 30 days, or 90 days. | ||
[[File:Imported devices3.png|207x207px]] | |||
[[File: | |||
This | == Activated devices == | ||
'''Activated devices:''' This statistic shows you how many devices have been activated (connected) over various periods: Today, 7 days, 30 days, or 90 days. | |||
[[File:Activated devices3.png|207x207px]] | |||
==Tasks== | |||
'''Tasks''' window shows created tasks statistic. | |||
'''Queued tasks:''' See a clear count of your currently pending tasks. | |||
'''Tasks overview:''' Get a breakdown of your task distribution by period (7 days, 30 days, or 90 days) and status. This includes tasks that are Completed, Completed with errors, or Failed. | |||
This information helps you to distinguish different task statuses. | |||
You can now hover over a device's status and click on it to filter out devices with the corresponding status on the Devices page. | |||
Task statuses are updated hourly. | |||
[[File:FOTA WEB tasks1.png]] | |||
==Firmware version and configurations== | |||
'''Firmware versions and configuration''' statistic window will mainly show how many devices are on a specific firmware version or have a specific configuration. This information helps you identify any devices with outdated firmware or configurations. | |||
You'll see the top 5 firmware versions or configurations initially, with an option to "Show more" to view up to 100 different entries. | |||
By hovering and clicking on specific firmware or configuration will lead you to the "Devices page" with applied filter. | |||
[[File:FW_and_CFG3.png]] | |||
==Company level== | |||
'''Company level''' window is designed to display a company's current level (Premium, Standard, or Basic), resource limits, and the current counts of created companies, users, and configuration files. | |||
[[File:Company level3.png|445x445px]] | |||
==News== | |||
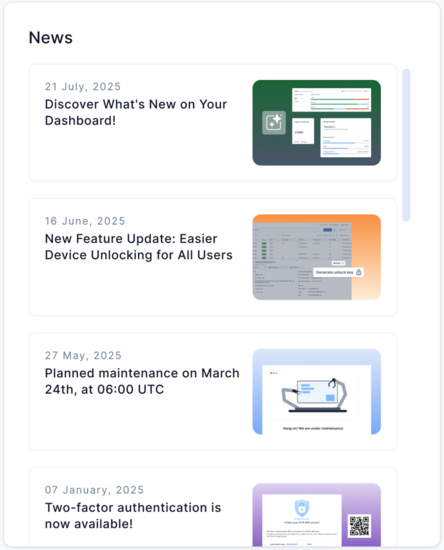
'''News''' window, it is designed to keep users updated with the latest information about FOTA WEB, such as system updates or newly added features and functionalities. | |||
[[File:News3.png|550x550px]] | |||
[[Category:FOTA WEB]] | [[Category:FOTA WEB]] | ||
Latest revision as of 08:26, 30 January 2026
Main Page > Software & Applications > FOTA WEB > FOTA WEB DashboardDashboard
Dashboard is the initial window of the FOTA WEB page upon successful login. It includes various useful general information about the solution or your current devices' status.
Devices status
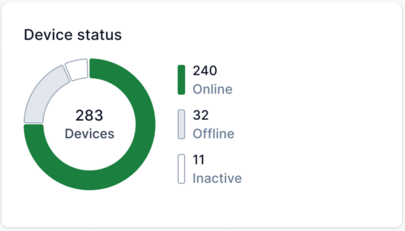
Device Status: This statistic shows information to the user on how many devices are Online , Offline or Inactive:
- Online - Device successfully connected at least once in the past 24 hours.
- Offline - Devices didn't connect to FOTA Web in the past 24 hours.
- Inactive - Device never connected to the FOTA Web.
By clicking on one of the device statuses, you will be directed to a list of devices with the corresponding status.
Imported devices
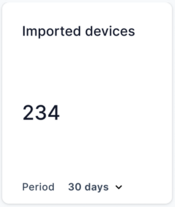
Imported devices: This statistic tracks how many devices have been imported over Today, 7 days, 30 days, or 90 days.
Activated devices
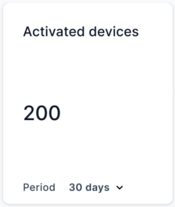
Activated devices: This statistic shows you how many devices have been activated (connected) over various periods: Today, 7 days, 30 days, or 90 days.
Tasks
Tasks window shows created tasks statistic.
Queued tasks: See a clear count of your currently pending tasks.
Tasks overview: Get a breakdown of your task distribution by period (7 days, 30 days, or 90 days) and status. This includes tasks that are Completed, Completed with errors, or Failed.
This information helps you to distinguish different task statuses.
You can now hover over a device's status and click on it to filter out devices with the corresponding status on the Devices page.
Task statuses are updated hourly.
Firmware version and configurations
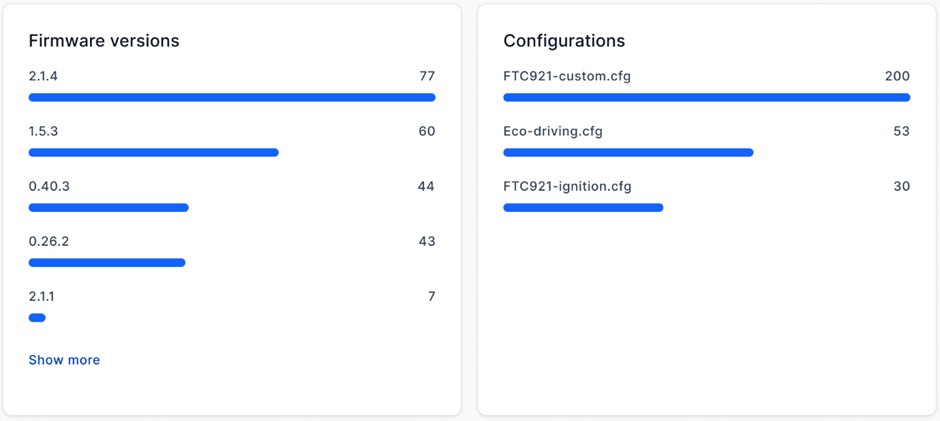
Firmware versions and configuration statistic window will mainly show how many devices are on a specific firmware version or have a specific configuration. This information helps you identify any devices with outdated firmware or configurations.
You'll see the top 5 firmware versions or configurations initially, with an option to "Show more" to view up to 100 different entries.
By hovering and clicking on specific firmware or configuration will lead you to the "Devices page" with applied filter.
Company level
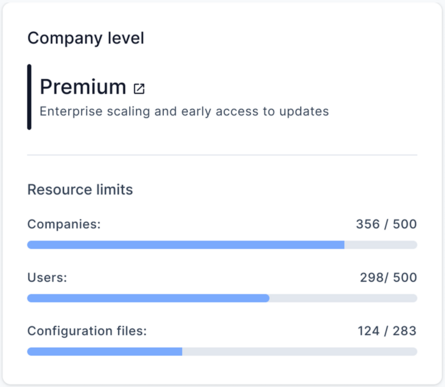
Company level window is designed to display a company's current level (Premium, Standard, or Basic), resource limits, and the current counts of created companies, users, and configuration files.
News
News window, it is designed to keep users updated with the latest information about FOTA WEB, such as system updates or newly added features and functionalities.
