Terminal
The Telematics Configuration Tool (TCT) introduces an easier way to debug FTx platform devices – Terminal tool. This new feature allows you to monitor their connected device actions and find possible issues related to the device’s functionality without using third-party tools.
Launching Terminal tool (Debug port) and connecting FTx device

Connecting to the "Debug" port allows you to read and save raw debug output directly from the connected device, providing valuable insights into its operation.
- To launch Terminal tool. At the top of the TCT window, click on “Settings” button and click then “Terminal”.
- Terminal tool can be launched in TCT start-up window or after connecting to the FTx platform device.
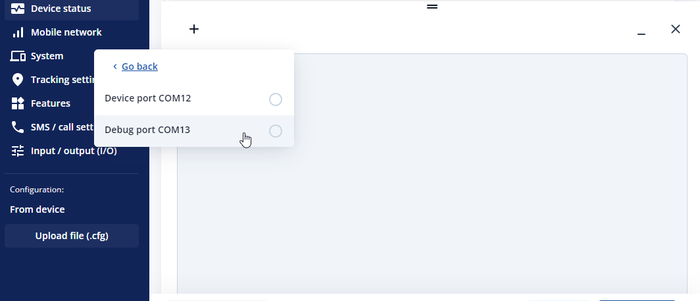
- To connect FTx platform device. Make sure that the device is connected to your computer and in Terminal tool press the “+” button on the left side of Terminal tool UI for a new connection, select the device from the dropdown list, and select the “Debug” port.

Note: Only one connection is available at the same time.
If everything is done correctly, you should see debug messages coming from the connected device.

Saving debug log into a file

Terminal tool holds about 500-1000 lines of debug messages in TCT UI, so if you want to gather more messages, we suggest saving debug messages into a file.
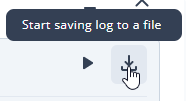
- When the debug messages are coming from the connected device, press “Save” icon on the right side of Terminal tool UI.
- Set a log file name and location where it should be saved.
- Debug messages will be saved into a file until the device is disconnected. For example, disconnecting the device using “Close” button next to the device connection.
Start/Pause log

When the debug messages are coming from the connected device, you can pause and resume incoming messages whenever you like using “Start/Pause” button on the right side of Terminal tool UI.
Note: If you are saving the debug log into a file, “Start/Pause” button doesn’t stop the log gathering in the file.
Resizing Terminal tool
For your convenience, Terminal tool can be resized using a button in the middle of Terminal tool window.
Minimizing Terminal tool
If Terminal tool takes too much of your screen real estate, at any given time you can minimize it using “Minimize” button on the right side of Terminal tool UI. Minimizing Terminal tool doesn’t stop debug messages logging.
Launching Terminal tool (Device port) and connecting FTx device
Connecting to the "Device" port allows you to send commands to the connected device and receive instant responses, allowing for precise troubleshooting.
- To launch Terminal tool. At the top of the TCT window, click on “Settings” button and click then “Terminal”.
- Terminal tool can be launched in TCT start-up window or after connecting to the FTx platform device.
- To connect FTx platform device. Make sure that the device is connected to your computer and in Terminal tool press the “+” button on the left side of Terminal tool UI for a new connection, select the device from the dropdown list, and select the “Debug” port.
Converting internal device binary logs
With 2.0.0 or later TCT version Terminal Tool can even convert internal device binary logs into human-readable text, enabling in-depth analysis of the device's previous behavior. When downloading logs (dump) from the FTx device using TCT, you will find both .bin and .txt files of the logs.
NOTES
Terminal is available in TCT desktop version only.
Terminal commands
| SERIAL COMMANDS | DESCRIPTION |
|---|---|
| .info | Returns device and firmware information |
| .reset | Asks watchdog to instantly reset software |
| @chrg_info | Reads the battery charge level and checks the charging status |
| @gps_pos | Gets device GPS location |
| @gps_nmea:<Value> | Enables/Disables NMEA logging:
Values: ? - Print current status 0 - Disable NMEA output 1 - Enable NMEA output 2 - Enable NMEA logging to file delete - Delete NMEA log files
|
| @rec_count | Shows the number of saved records |
| @rec_deleteall | Deletes all records from device memory |
| @rec_send:<amount> | Sends the specified number of records to the server |
| @rec_save:<priority> | Generates and saves record with selected priority
low - selects low priority for record generation high - selects high priority for record generation |
| @rec_save_io:<avl_id> | Generates and saves eventual record as if specified IO element would have generated it |
| @vfs_stat | Provides information about internal device memory size and usage |
