What debug information should be collected?
Introduction
Efficiency is the ability to avoid wasting materials, energy, efforts, money, and time in doing something or in producing a desired result. Technical support department desired result is a resolved query, which leads to Your satisfaction.
This guide will walk you through the process what information helps answer queries more efficiently and accelerate the process of solving any questions you might have. Time will not be spent in search of details required to solve a query and this way You will save from 2 to 3 days of time.
In the next page you can find a table with needed information in Query and instructions on how to gather that information.
Steps
1. Gather information about the issue, what is the Device model, Configuration, Firmware/Configurator
Device: FMB0X0/FMB1XY/FMB920/FMB640 etc.;
Configuration: Attach configuration file
Firmware version: 03.XX.YY.Rev.ZZ
Status information: responses to relevant SMS/GPRS commands
Provide IMEI and GSM number of 1-3 devices with the issue
2. Specify the number of devices and how often the issue repeats
Repeating: Often/Randomly/Everyday/There is a pattern/Under certain conditions;
If the Repeating is specified as “Under certain conditions”–write on how to repeat those conditions
3. Provide additional information
Log files - Provide live information when the issue is happening. They can be taken via the Configurator.
Dump files - Provide files that the device logged automatically. You have to make sure to take them from FOTA WEB or Configurator
*If you cannot gather information from one of the steps, they can be skipped however inform the engineer in the query
| Information | How to get it | Why we need it | Example |
|---|---|---|---|
| Device information | This information has to be gathered from your platform or your system which monitors devices | It will help to understand the scale of the issue and also find the cause more quickly by finding the connection between affected devices. | Number and model of affected device: 2 devices of FMB001 |
| Firmware version | SMS command | The firmware version will allow us to analyze if the said issue was not already fixed in a newer firmware version, | Firmware: 03.25.15.Rev.05 |
| Configuration | Configuration can be downloaded directly from device through FOTA WEB, FOTA or Configurator.
|
The configuration used on the device allows us to analyze if the issue is not caused by improperly configured settings or features. | Attach the device configuration to Query. |
| How to repeat | Monitor the devices on the server and provide information, under which conditions issue occurs. | It will help the engineer better understand the conditions and how to repeat it personally, which will lead to a faster solution. | Device goes into Deep Sleep, when device wakes up from Accelerometer, event (Movement AVL I/O ID 240) is not sent to server. |
| Log files | They can be taken via the Configurator Maintenance tab or via Terminal. | The logs allow the engineers to provide you with initial insights into your issue with first response. | Attach the taken Log file to Query. |
| Dump files | You have to make sure to take them from Configurator Maintenance tab or FOTA WEB after issue happened. And take them not more than 2 or 3 hours after the issue otherwise device overwrites those files. | The dump files allow the engineers to provide you with initial insights into your issue with first response. | Attach the taken Dump files from FOTA WEB or Configurator to Query. |
| Status information | SMS/GPRS commands such as
getinfo getver getstatus getgps can be used to provide valuable information. |
Depending on the issue, Status information will allow us to analyze the issue more quickly and possibly provide a solution immediately. | SMS responses to getver from device:
Ver:02.00.01_06 GPS:AXN_3.80_3333_16070400,0000,, Hw:FMB120 Mod:4 IMEI:352094082042885 Init: 2017-6-16 5:54 Uptime: 16574 MAC:002E43912EF7 SPC:0(0) AXL:0 OBD:0 BL:1.6 BT:4
|
How to get Debug Information
Follow these quick steps to get all the necessary debug information in just over 10 minutes.
If you correctly perform all the steps and describe the issue clearly there is a high chance that we can solve it on our first reply.

1. Open up your device via configurator and go to Status -> Maintenance window
2. Click "Dump" to take the information from the device containing logs from the past that device made automatically. If the issue happened 2-3 hours ago we will see it in these files.
Note 2.1: If the device is installed in a vehicle and deployed in the field you can use FOTA WEB to download these files remotely.
3. If you want to repeat the issue now, you can use logging functionality accessed in the same window. Just start logging by clicking "Log" replicate the issue and when the log ends to attach it to the query. When logs are made they export your current configuration as well.
Note 3.1: For example, you should send SMS during the logging period if you claim that your device is not receiving SMS.
Note 3.2: For troubleshooting remote vehicles download DUMP files via FOTA and download them as soon as possible after replicating the issue.
4.After the logging is done "Open directory" button in the configurator to find your DUMP and LOG+CFG files.
5. If you have not made a log file in step 3, export your configuration file by using the "Save to file" button.
Note 5.1: In the GIF file is save to Documents folder for quick access by pressing the "Open directory" button in the configurator.
Log capturing using terminal

All our devices are able to transmit their current state when they are connected to PC using USB cable.
Log file is used to detect errors and provide information when device is operating unexpectedly.
Required Terminal application for log capturing can be downloaded here: Terminal
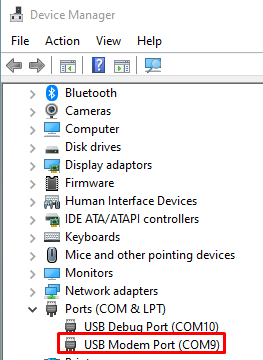
After connecting device to PC, it creates two ports:
- USB Debug Port - used for modem trace.
- USB Modem Port - used for terminal log.
If connected device is not recognized by PC, please install appropriate drivers.
Download Teltonika COM port driver from the link: COM port driver
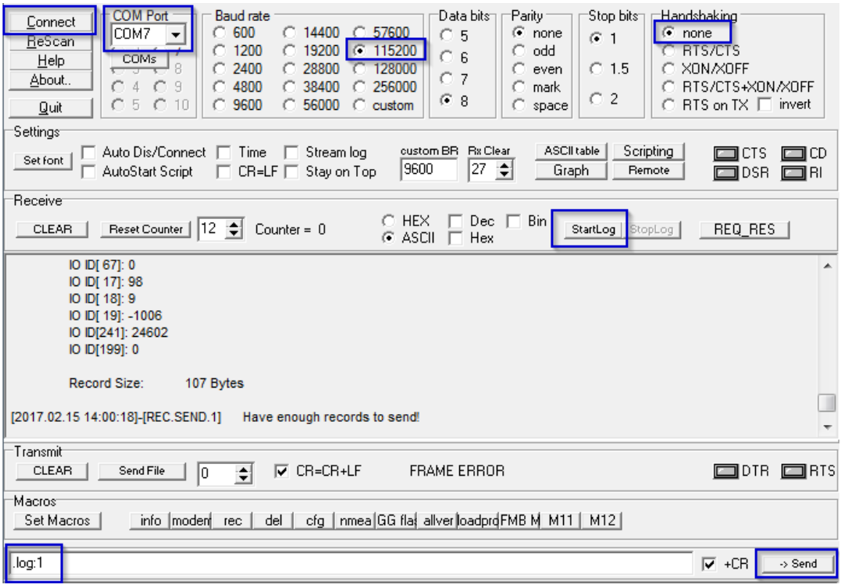
Follow these steps to start log:
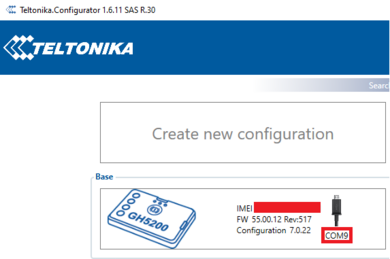
- select COM port;
- select the baud rate;
- handshaking parameters;
- click connect and "Start Log" button.
If log is not running, please send .log:1 command (see picture below). Now you are able to monitor all internal processes happening in the device. All logged process is saved in the txt file.
Note: Send command .log:0 to stop logging.


