Difference between revisions of "FMT100 Getting Started with AWS IoT Core"
(Created page with "{{Template:AWSFMT100|model=FMT100}} {{Template:AWSinstructions}} {{Template:TroubleshootAWS}} {{Template:AWSdebug|model=FMT100}} 5") |
(Created page with "{{Template:AWSFMT100|model=FMT100}} {{Template:AWSinstructions}} {{Template:TroubleshootAWS}} {{Template:AWSdebug|model=FMT100}} 5") |
(No difference)
| |
Latest revision as of 10:24, 2 March 2023
Main Page > Fast & Easy Trackers > FMT100 > FMT100 Manual > FMT100 Getting Started with AWS IoT Core
Document Information
Glossary
- Wiki – Teltonika IoT knowledge base - https://wiki.teltonika-iot-group.com/.
- FOTA – Firmware Over The Air.
- Configurator – Tool to configure Teltonika Telematics devices.
- Crowd support forum – knowledge base dedicated for Troubleshooting.
For firmware supporting MQTT please contact your sales manager or contact directly via Teltonika Helpdesk.
Other software required to develop and debug applications for the device
For debugging situations, device internal logs can be downloaded OTA by using our FotaWEB platform or by using Teltonika Configurator.
Setup your AWS account and Permissions
Refer to the online AWS documentation at Set up your AWS Account. Follow the steps outlined in the sections below to create your account and a user and get started:
Pay special attention to the Notes.
Create Resources in AWS IoT
Refer to the online AWS documentation at Create AWS IoT Resources. Follow the steps outlined in these sections to provision resources for your device:
Pay special attention to the Notes.
Provide Device with credentials
Whole device, AWS IoT and testing information can be downloaded in PDF format here.
NOTE: MQTT will not work without uploaded TLS certificates.
AWS IoT Core Configuration
Setting up AWS IoT Core
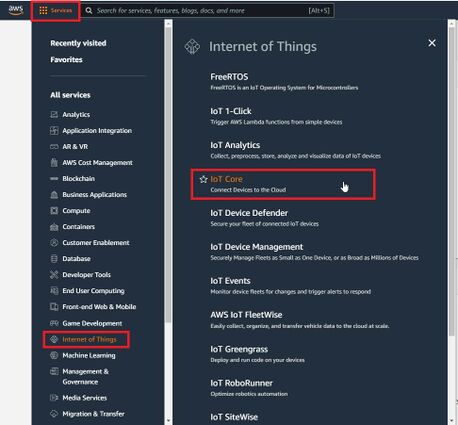
When logged in the AWS console, click on Services on the top left hand side screen, to access IoT core.
NOTE: If you can't see "Services" in the top left, click on "My account" in the top right and "AWS Management Console"
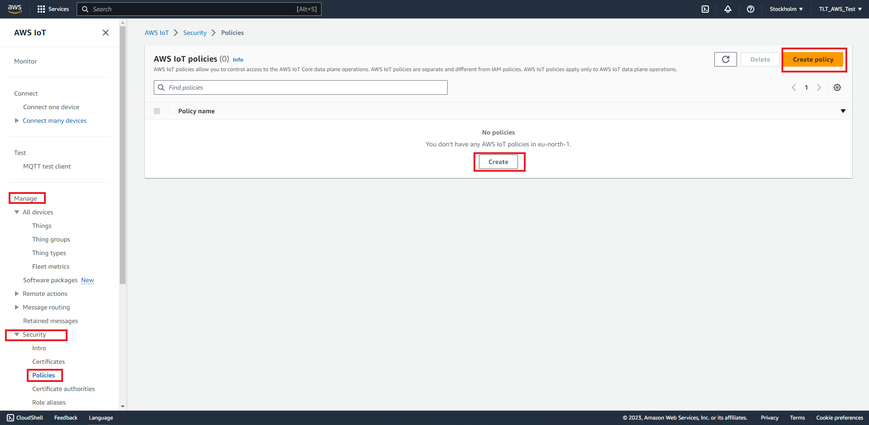
Select Manage, Security, Policies (Manage > Security > Policies) and press Create policy or Create buttons.
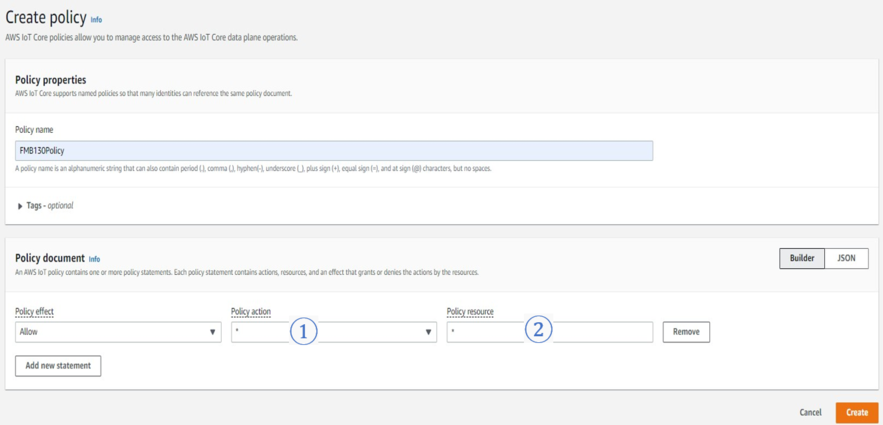
In the Create Policy window, enter Policy name. In the Policy document tab for Policy Action (1) select “*” and for Policy resource (2) enter “*” and press create.
Now, that you have created a policy, select Manage on the sidebar on the left side, then select All devices, Things (Manage>All devices>Things). And click on Create things.
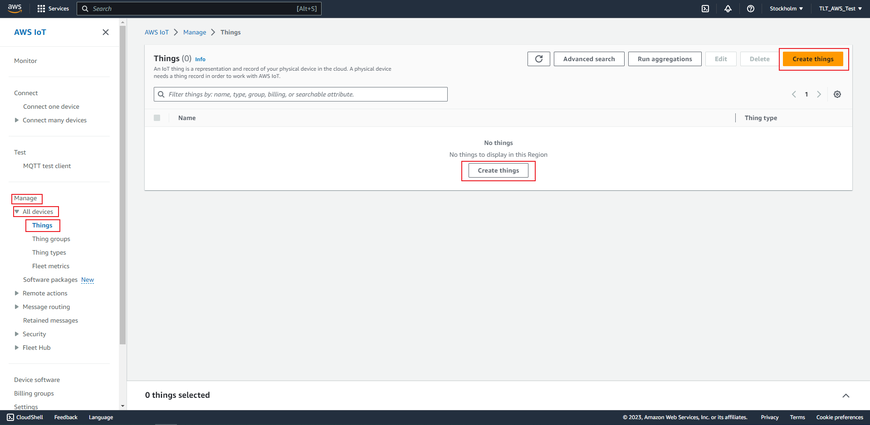
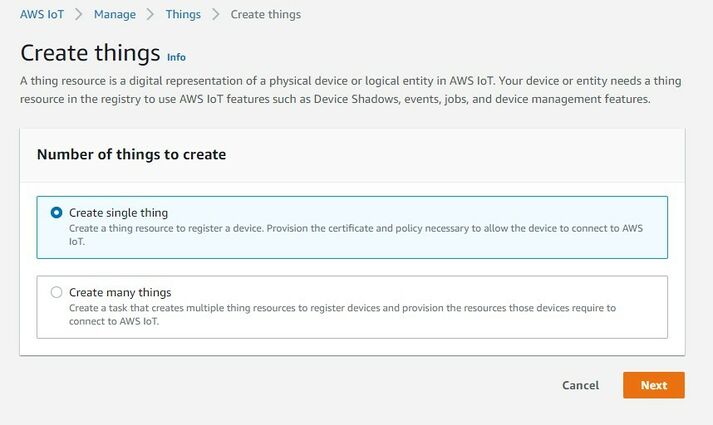
Afterwards select Create single thing and click Next.
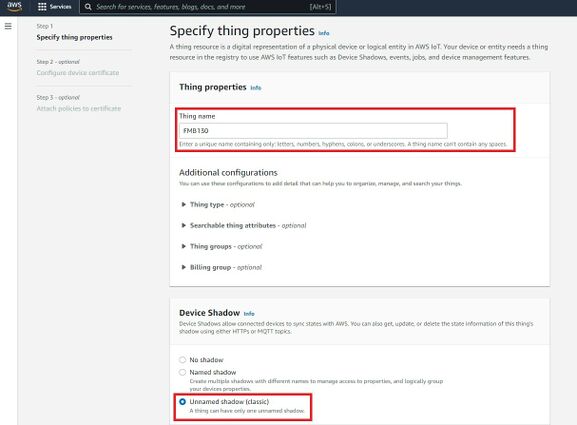
After creating a single thing, enter Thing’s name and in the Device Shadow tab select Unnamed shadow (classic). Then click Next.
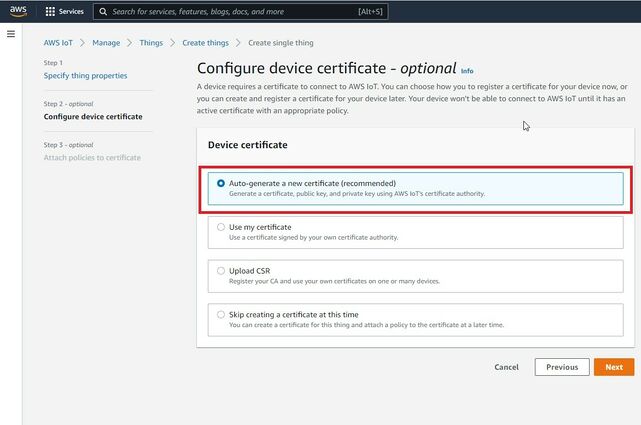
Then when selecting Device certificate, select Auto-generate a new certificate and click Next.
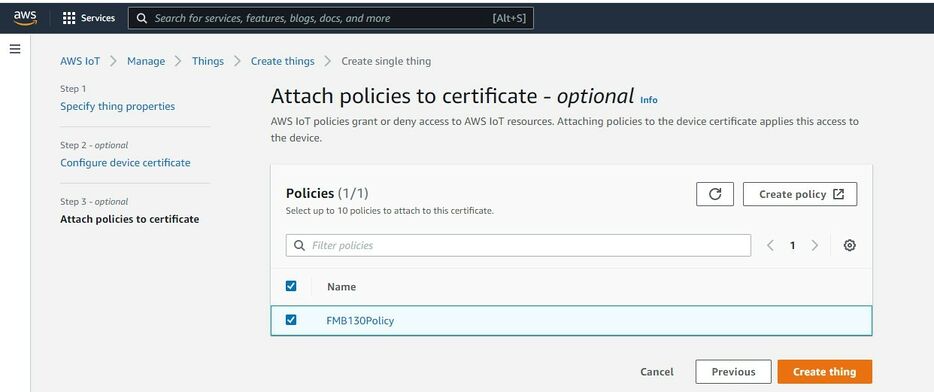
Now, select the policy you have created before to attach it to the certificate and thing. After that click Create thing.
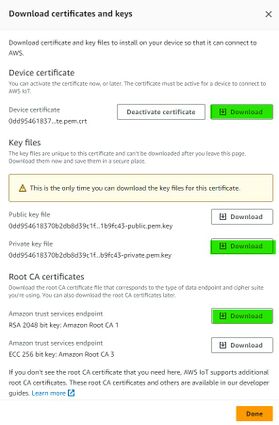
Then window with Certificate files and key files download options should pop out. It‘s recommended to download all files, because later some of them will not be available for download. The files that are required for usage with FMX devices are: Device certificate (1), private key(2), and Amazon Root CA 1 file(3), but it‘s recommended to download them all and store them in secured place.
Finding device data endpoint (server domain)
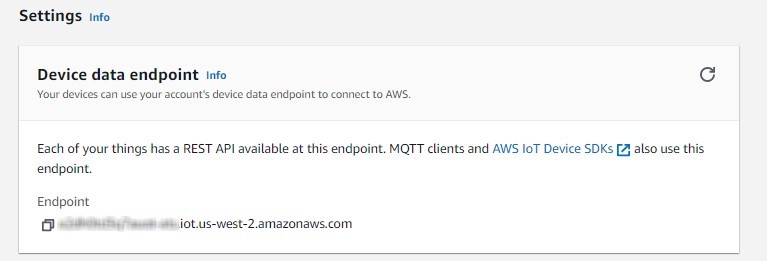
To receive server domain (in AWS endpoint) click on the side bar on the left Settings (AWS IoT->Settings).
Or click on the side bar on left side Things, select the created thing, after it click Interact->View Settings. Whole path - (Things->*YourThingName*->Interact->ViewSettings). Page containing endpoint will open. Copy the whole endpoint address.
Port for accessing this endpoint is 8883.
Configuring the device
Security and certificates
Using certificate, private key and root certificate. (Via Cable)
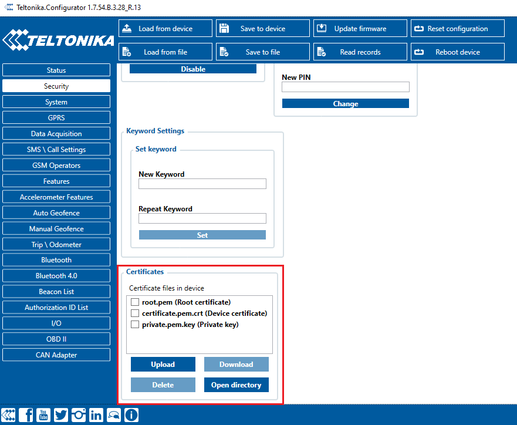
Find Certificate file ending with extension pem.crt (ending may be just .pem) Private key file and AmazoonRootCA1 file (no need to change filenames). These files should have been downloaded when creating Thing in AWS IoT Core.

Upload the mentioned files in the Security tab in the Teltonika Configurator.
After uploading certificates, go to System tab and in Data protocol section select - Codec JSON.

Device GPRS configuration for AWS IoT Custom MQTT settings
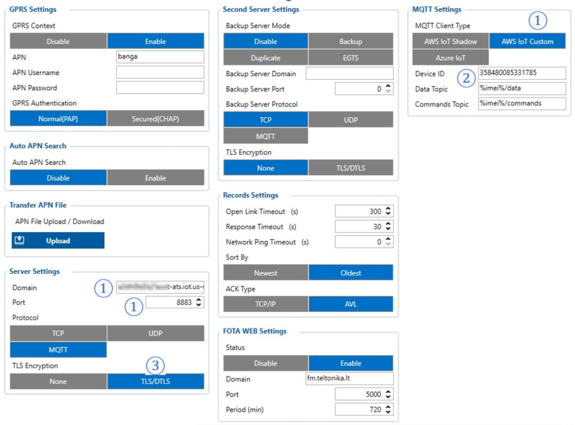
In the GPRS tab, under Server Settings select:
- Domain – Endpoint from the AWS, Port: 8883
- Protocol – MQTT
- TLS Encryption – TLS/DTLS
In the MQTT Settings section select:
- MQTT Client Type – AWS IoT Custom
- Device ID – enter device IMEI (optional)
- Leave Data and Command Topics unchanged.
Save the configuration to the device.
Checking received data and sending commands in the AWS IoT core
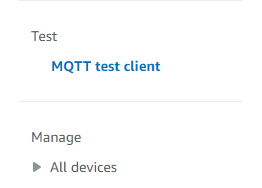
The data received from the device can be found in the MQTT test client, which can be found above “Manage” in the sidebar on the left.
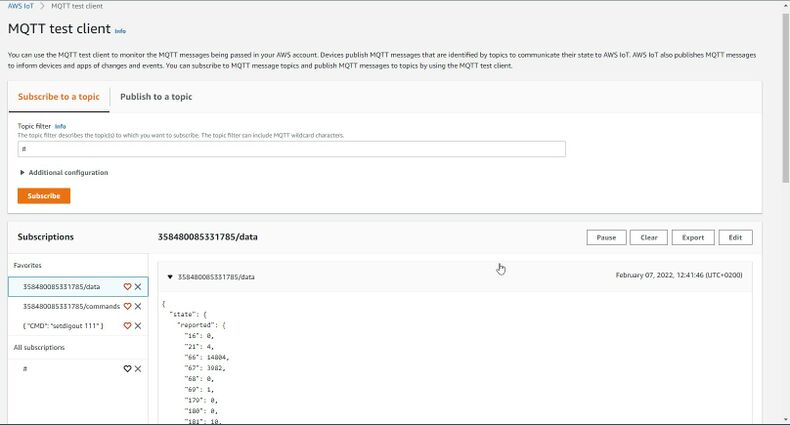
To see incoming data, subscribe to topic - *DeviceImei*/data . Or subscribe to # to see all incoming outgoing data in the Topics.
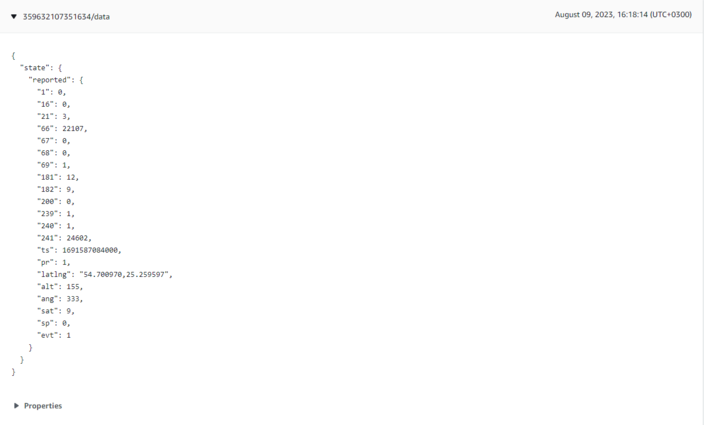
Incoming data is received in JSON format, for e.g.:
To send SMS/GPRS commands to the device subscribe to a topic name - *DeviceIMEI*/commands, and, in the same MQTT test client window select Publish to a topic. Enter topic name - *DeviceIMEI*/commands. In the Message payload enter wanted GPRS/SMS command in following format and press Publish:
{“CMD”: “<Command>”}
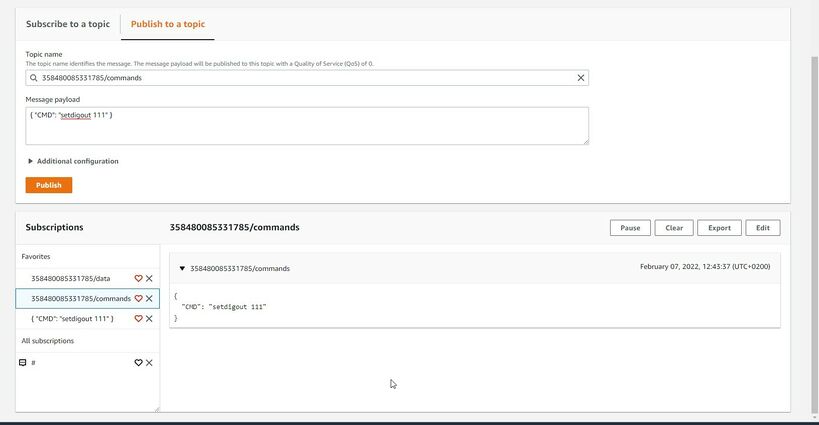
The response to the command will be shown in the Data topic:

Debugging
In the situation when the issue with information upload appears, device internal logs can be taken directly from device configuration software (instructions), via Terminal.exe by connecting selecting device USB connection port, or by receiving internal logs via FotaWEB in task section.
Troubleshooting
The information can be submitted to Teltonika HelpDesk and Teltonika engineers will assist with troubleshooting. For a more detailed information regarding what information should be collected for debugging, please visit the dedicated page on Teltonika Wiki.
Alternatively, Teltonika has a Crowd Support Forum dedicated for troubleshooting, where engineers are actively solving problems.
Debugging
In the situation when the issue with information upload appears, device internal logs can be taken directly from device configuration software (instructions), via Terminal.exe by connecting selecting device USB connection port, or by receiving internal logs via FotaWEB in task section.
