Difference between revisions of "FOTA WEB Dashboard"
m |
|||
| (One intermediate revision by the same user not shown) | |||
| Line 3: | Line 3: | ||
'''Dashboard''' tab is what you see first when logged in to FOTA WEB. It can be divided into few distinct sections – News and announcements panel, Company resources, Device statistics and Batches. Here is the brief overview of each section: | '''Dashboard''' tab is what you see first when logged in to FOTA WEB. It can be divided into few distinct sections – News and announcements panel, Company resources, Device statistics and Batches. Here is the brief overview of each section: | ||
| − | [[File:Dashboard FOTAWEB | + | [[File:Dashboard FOTAWEB.png|frameless|1076x1076px]] |
=='''News and announcements panel'''== | =='''News and announcements panel'''== | ||
| Line 25: | Line 25: | ||
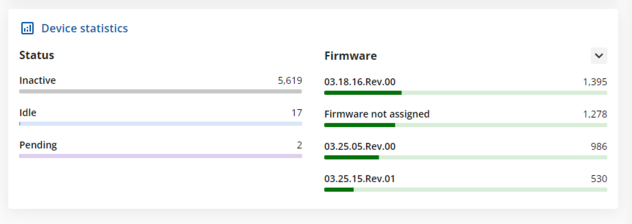
The device statistics area shows the device status and firmware statistics in column graphs, with the most common status or firmware options at the top and the least popular options at the bottom. | The device statistics area shows the device status and firmware statistics in column graphs, with the most common status or firmware options at the top and the least popular options at the bottom. | ||
| − | [[File: | + | [[File:Device Statistics.png|frameless|632x632px]] |
=='''Batches'''== | =='''Batches'''== | ||
Revision as of 15:46, 8 December 2021
Main Page > Software & Applications > FOTA WEB > FOTA WEB DashboardDashboard tab is what you see first when logged in to FOTA WEB. It can be divided into few distinct sections – News and announcements panel, Company resources, Device statistics and Batches. Here is the brief overview of each section:
News and announcements panel
This area shows any important news or announcements that are provided by our FOTA WEB team.
Company resources
This area provides a basic overview of company resources, like:
- How many devices are currently assigned to the company
- Amount of tasks created
- How many separate groups are created in the company
- Amount of files uploaded and generated
- How many users have access to this company
This panel also works as a navigation tool, so You can click on any of the resources windows and it will open it's respective menu.
Device statistics
The device statistics area shows the device status and firmware statistics in column graphs, with the most common status or firmware options at the top and the least popular options at the bottom.
Batches
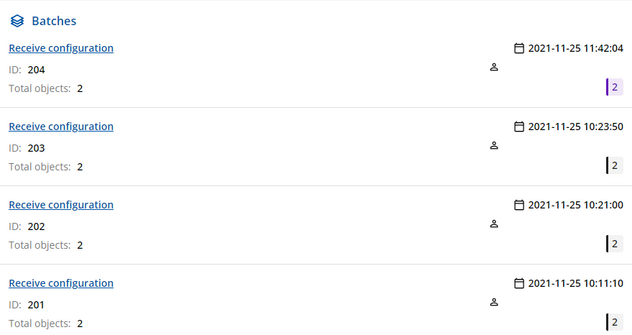
The batches area allows You to see and filter bulk tasks that had been run in the Company. This includes the following batch information:
- Name of the task
- Task ID
- Amount of objects (devices) that had this task assigned
- The date and time when the task was initiated
- The email address of the task initiator
- Status of the task with the number of devices in this batch with the specific status. The task statuses are color-coded:
- Purple - Task is pending (System is waiting for the device)
- Light Blue - Task is running currently
- Green - Task is completed successfully
- Black - Task was cancelled
- Red - Task failed.
- Yellow - Task is completed with errors
Cancelling tasks using Batches area
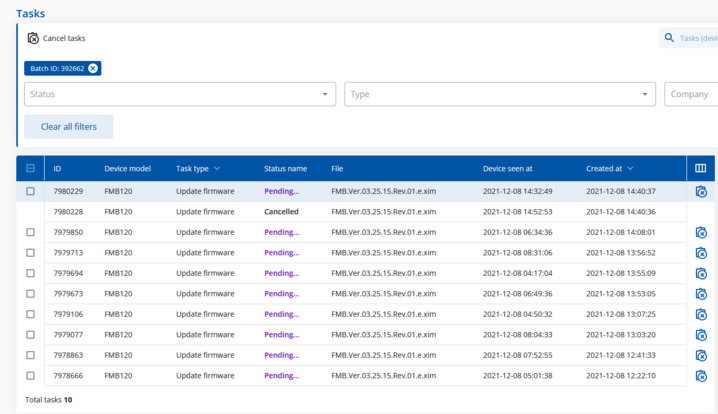
Another feature of the Batches area is an ability to cancel multiple tasks at once. Each batch, that has an underlined name, can be used to filter the tasks that were created in the same batch.
After clicking on the batch name, You will be redirected to the tasks page, where the system will automatically filter out all tasks from the selected batch.
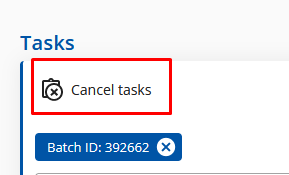
In here You can cancel tasks one-by-one, or You can click "Cancel Tasks" at the top left corner of the tasks page to cancel all tasks from the selected batch.
Next chapter Devices


